Prefer watching?
Steps to follow
- Add 3D Viewer Visual to your Power BI report or dashboard.
- Locate the "Color By" input. This input allows you to define which field will be used to color the elements in the viewer.
- Select a field from your received data that you want to use for coloring. It could be a field received through Power BI Data Connector or an external data source. The choice is yours!
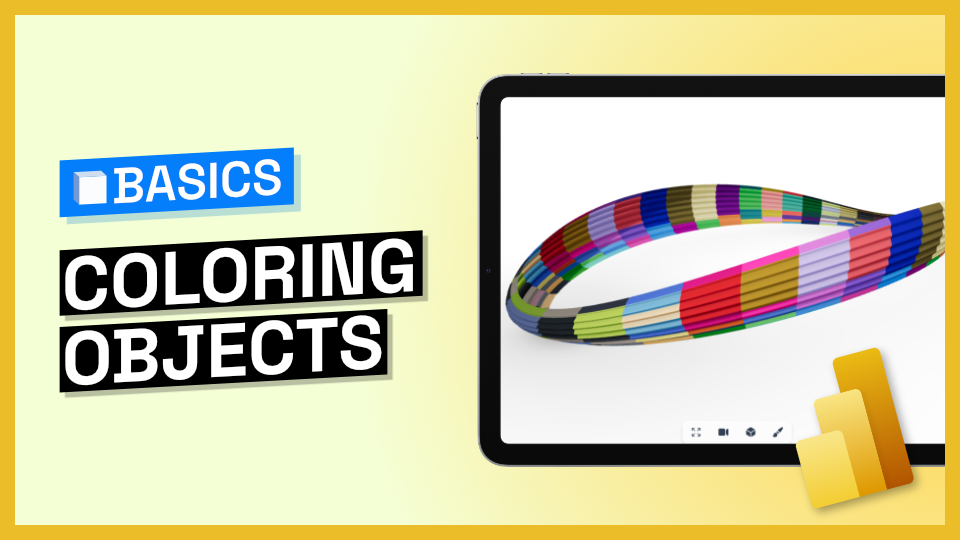
- The 3D Viewer will automatically assign colors using Power BI's color palette.
- Optionally, you can create a relationship with an external data source and use that for coloring.
That’s it! Now you can color your model from Grasshopper, Navisworks, or any other application we have a connector for, inside Power BI.


