With Speckle, you can easily transfer your models and data from one software to another, and that's just the start of the journey; you can also create apps that integrate with Speckle to leverage that information in new ways that matter to you, your team and your clients.
It's your data, you own it!
We started building some demo Speckle Apps to showcase some of these possibilities, and the latest addition to the list is Revit DASH.
::: tip TLDR
👉 You can find the app at dashboards.speckle.xyz
👉 And the code in our Github repo
:::
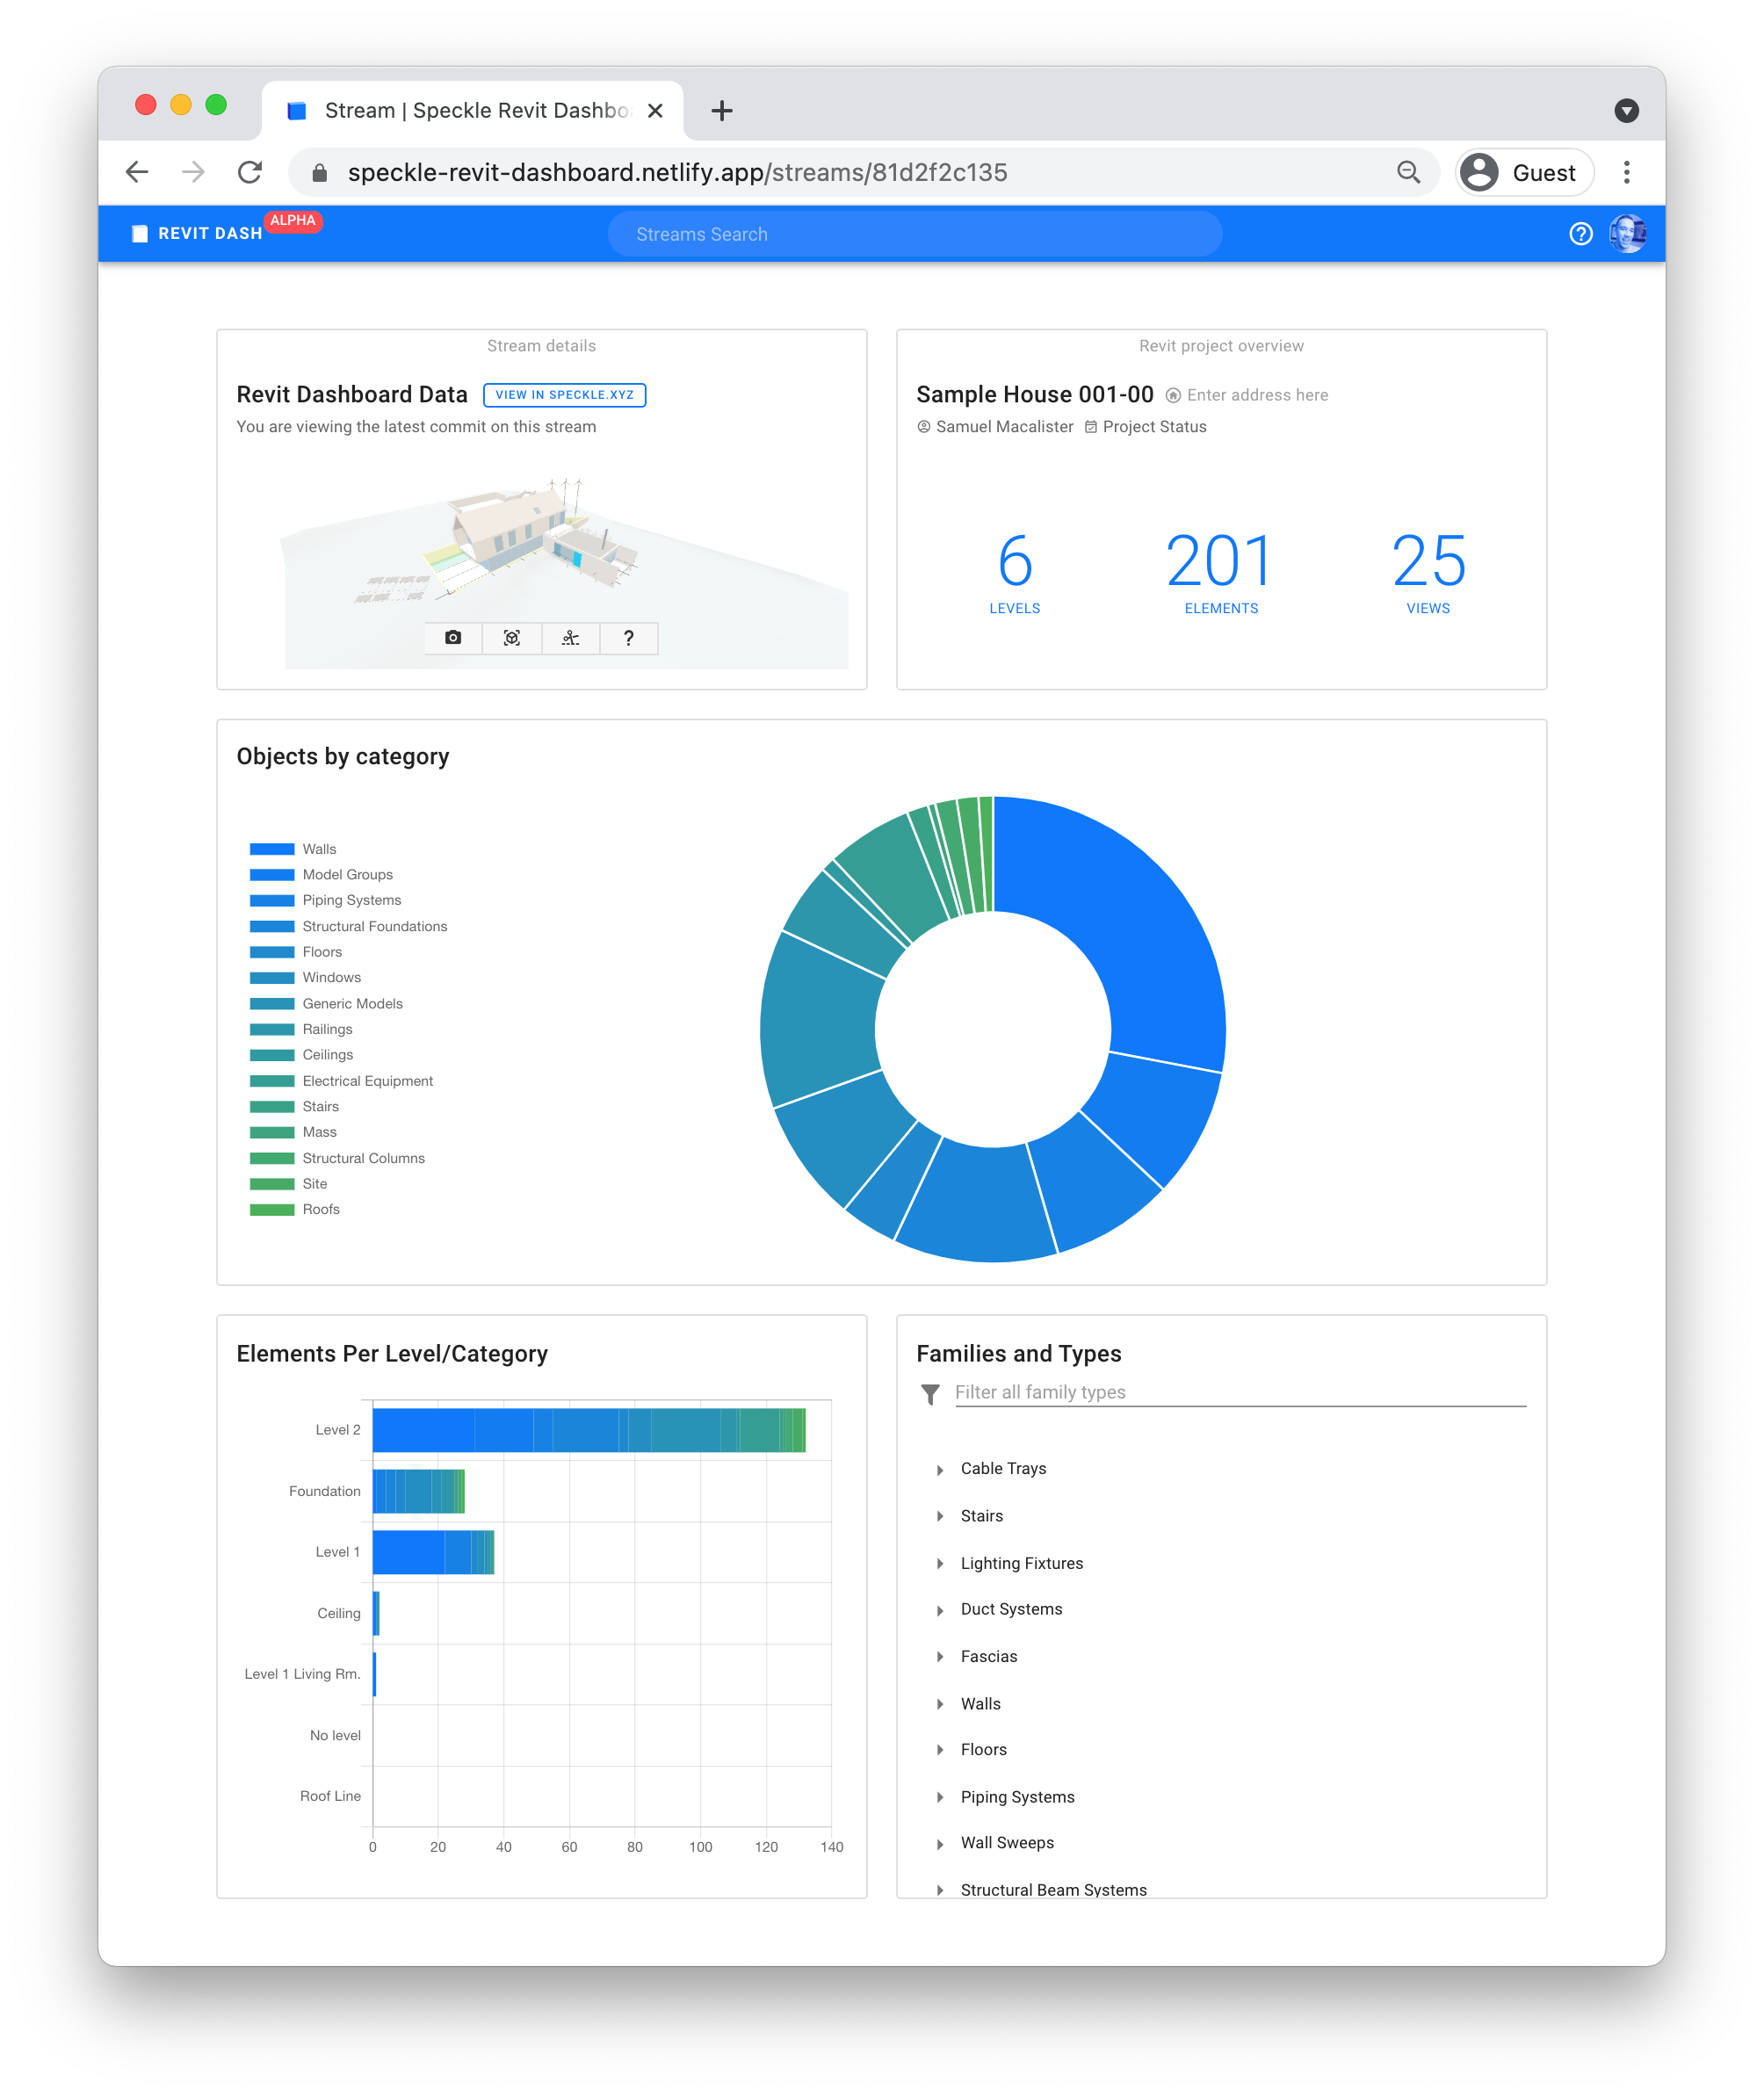
This app allows you to get a quick breakdown of any Revit model. More ins specific, it allows you to see:
- a high-level report of the stream data, as well see a small 3D preview of the model
- the project information stored in the Revit model, and a breakdown of general metrics (elements, levels, views...)
- a breakdown of elements by category, with a filterable legend.
- a breakdown of elements by level and category.
- a detailed view of all available types/families in the model.
::: tip FYI
This post is not intended as a tutorial on how to build your own Speckle apps. For that, we started a separate tutorial series that you can find here 👈
Other ways of integrating with Speckle are possible! We also published a guide on creating your own Speckle bot for Discord! You can find it here 👈
:::
How does it work?
::: tip Pre-requisite
We're assuming you already have an account on speckle.xyz and that you have both Speckle Manager and the Revit Connector installed.
If you haven't, check out our Getting started with Revit tutorial before you continue!
:::
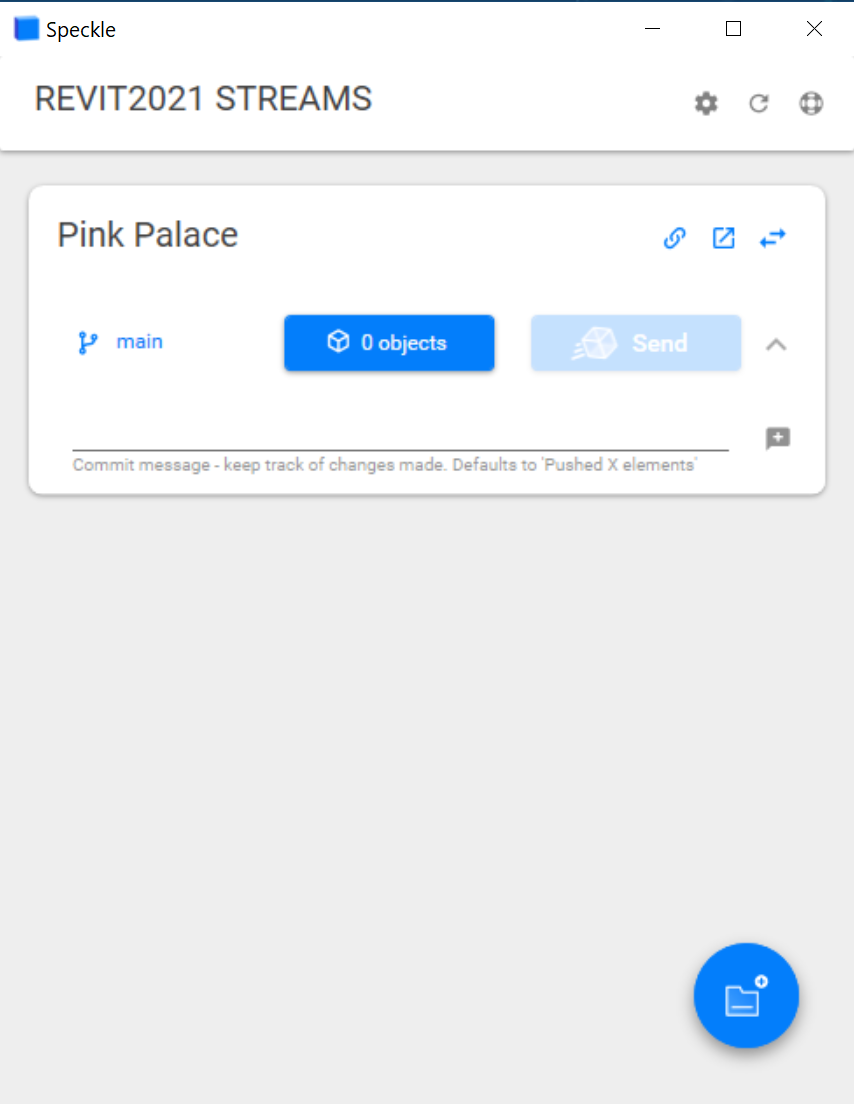
From Revit, add the stream you want to send your data to (or create a new one).
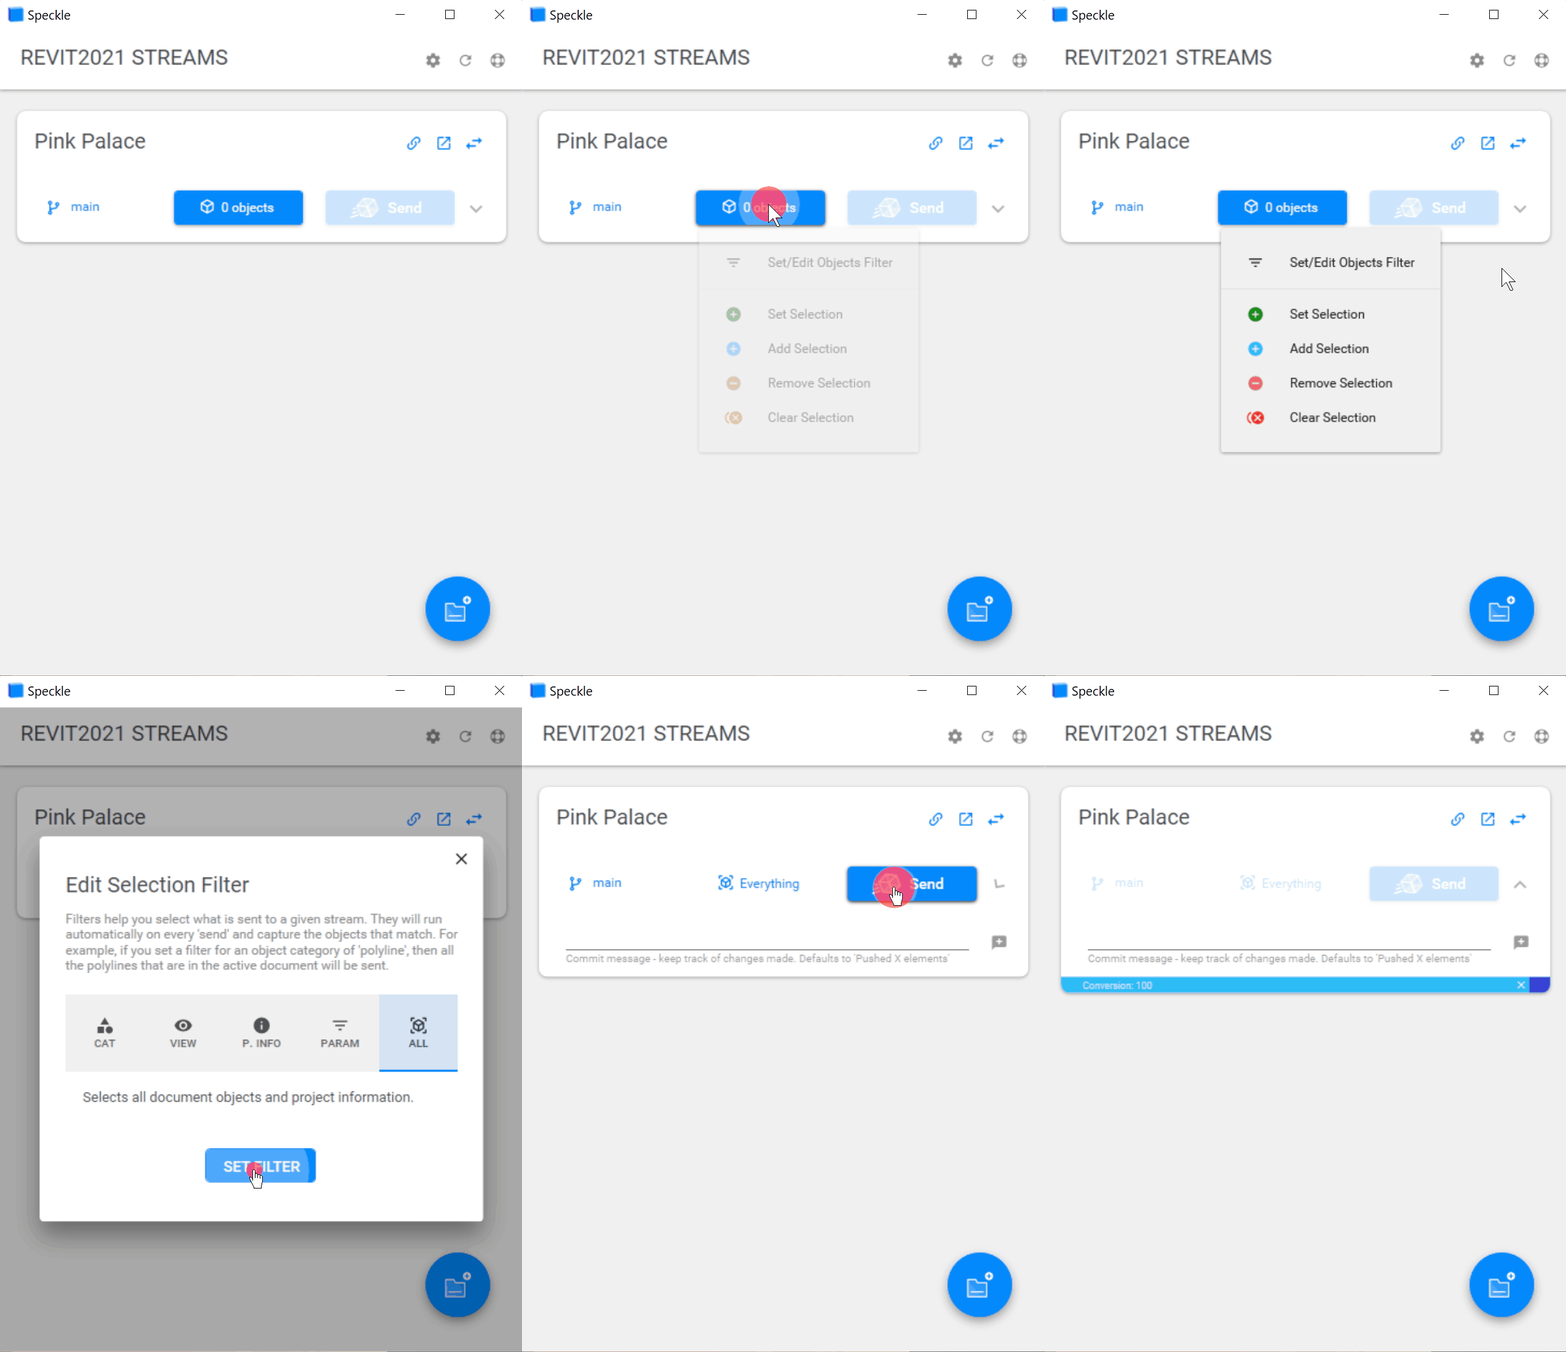
From the selection dropdown, pick "Set/Edit Objects Filters", and select "All" since we want to analyse the information of the entire Revit model. Once the filter is set, press "Send" and wait for the process to finish.
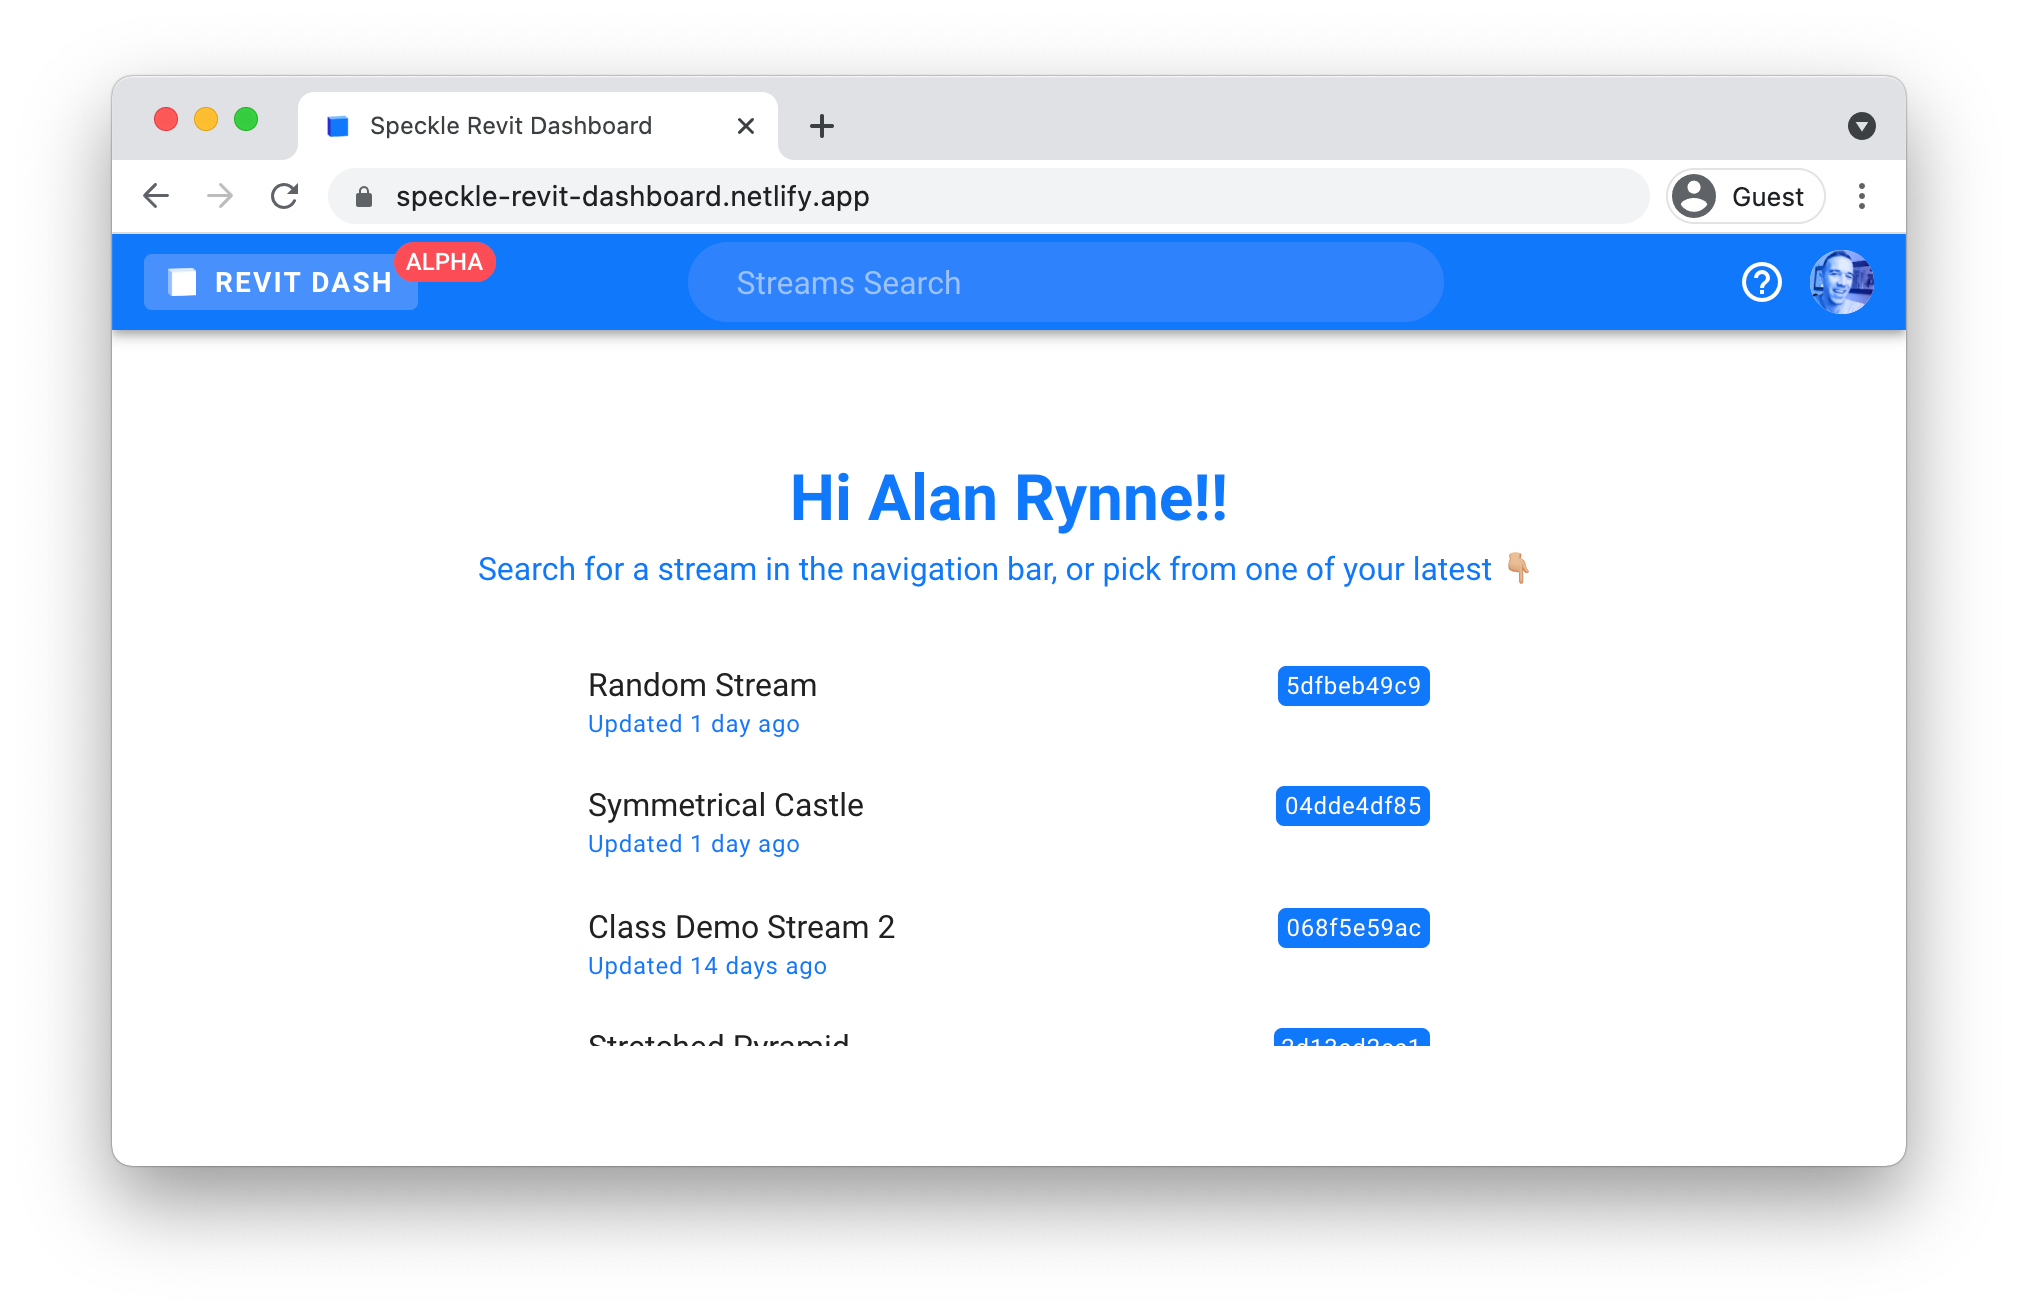
Now, head over to dashboards.speckle.xyz and log in if you haven't already.
You'll find a panel with the last updated streams you have access to, pick the one you sent the data to. Alternatively, you can also find the stream using the search bar at the top.
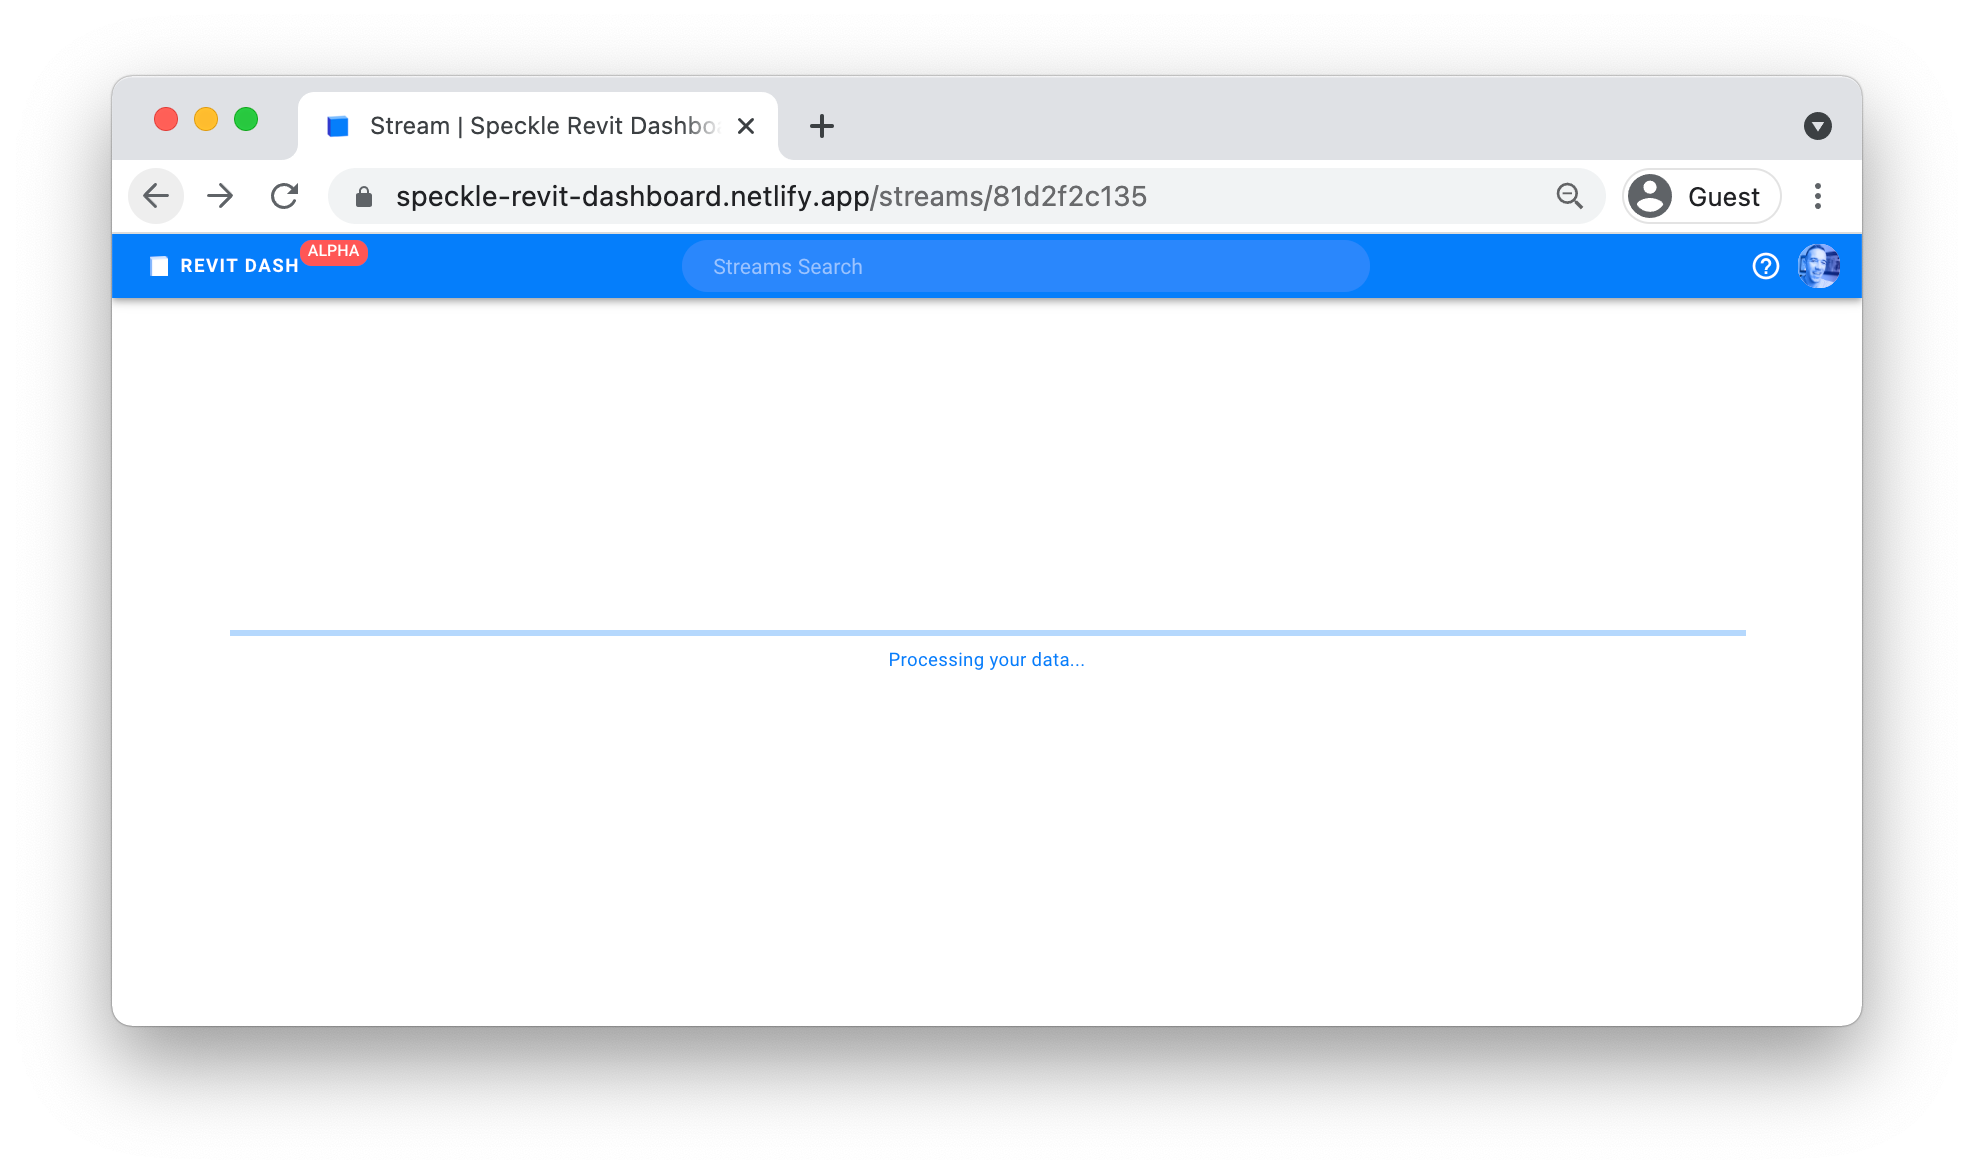
Once a Stream has been selected, the app will receive the information from Speckle (just like any other connector) and process it live to display the results. Depending on the size of your model, processing the data may take a bit.
If all went well, the dashboard should be showing up in your screen:
::: tip And that's it!
Every time you visit this page, you'll get a report of the latest data in your project. No need to remember to update your dashboard data.
:::
Limitations
- Unless you deploy it yourself, the app currently only works on our public server: speckle.xyz
- The current version of the app will only fetch the latest commit from the
mainbranch of a Stream. - The app also requires to send your data from Revit using the 👉All👈 filter option, as it requires a complete picture of your model to work properly (aka Project Information).
::: tip Feedback
If you encounter any problems while using this app, you can let us know at our Community Forum, or open an issue on the Github repo
:::
Who is this for?
Project managers, BIM modellers, and any other professional that needs to extract key insights of their models in real-time, without dealing with complex import/export processes.
It's also for any owner of a Speckle server that may want to use this app with their own server. If you're one of those people, the next section is for you 👇
What about the technical stuff?
We know the wonderful nerds out there will be asking themselves: "So how does this work?"
This app leverages the use of your Speckle data through our 3rd-party Apps feature and the GraphQL API, as well as using OAuth 2.0 for authentication.
The application itself is built using Vue.js, a javascript framework that's becoming extremely popular. The app structure and code is based on our first issue of the Create your own app tutorial, so go check it out if you want to get started!
::: tip
I want to deploy my own!
Fear not, all the app's code is publicly available on its Github Repo, with some instructions on how to run it locally.
:::
More to come!
This is just the alpha release of this app. In future releases, we'll include the ability to view the entire history of a Specific stream, compare across different commits to analyse progress and model quality along the entire span of a project and improve the key measures and graphs.
::: tip Feedback
We'd ❤️ to hear your feedback, if you have any suggestions you can always find us on our Community forum!
:::


